US-China AI Race Chart
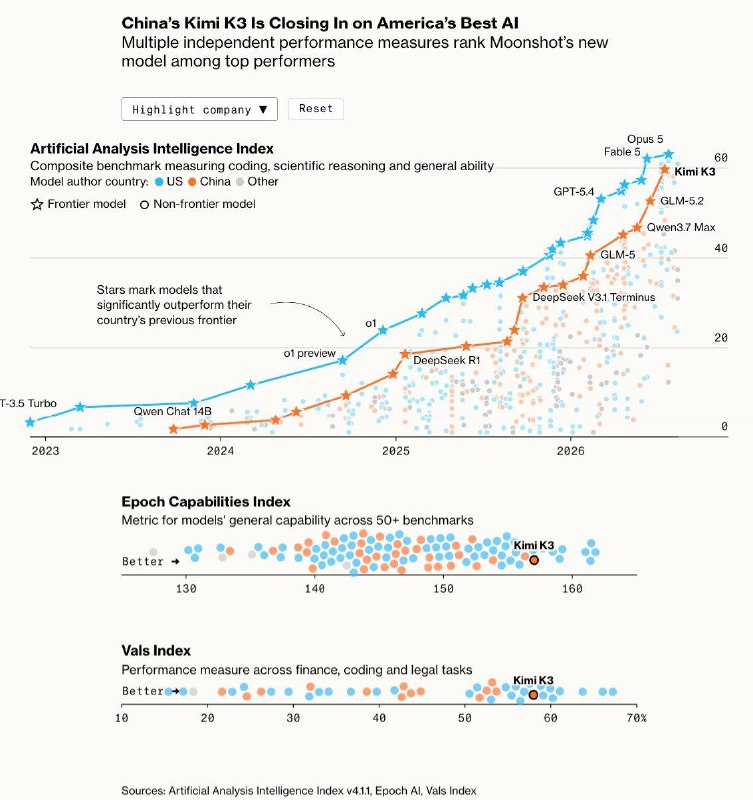
The chart illustrates the narrowing gap in capabilities between Chinese and American AI models over recent years.
A very telling chart from a recent Bloomberg article.
The orange dots represent Chinese models, while the blue ones represent the USA. The Y-axis shows the weighted average across benchmarks such as GDPval-AA v2, τ³-Banking, Terminal-Bench v2.1, Humanity’s Last Exam, GPQA Diamond, CritPt, SciCode, AA-Omniscience, and AA-LCR.
The frontier models are connected by a line. It is evident how much the gap in capabilities has narrowed over the past couple of years (and GLM-5.3 is not even on the chart). Many American leaders still claim that Chinese models lag by 6-9 months, but this information is clearly outdated. Not to mention the pricing.
Why it matters
AnalysisThis chart highlights the rapid progress of Chinese AI models, which could significantly impact global competitiveness in the tech sector.
Discuss in community
Share your questions and insights with developers
Related in Ecosystem
Practical guides, core terminology, and agent skills
GPT Image Generative Models Prompting Guide
OpenAI's gpt-image generative models are designed to produce production-quality visuals and fully controllable creative workflows. They are suitable for both professional design ta...
Claude Sonnet 4.6 vs GPT-5.5 vs Gemini 3.1 Pro: 2026 model comparison
Every few weeks, a new model comes out, and every time the same questions arise: should I switch? what changed what to pay for?
Binance publishes investigation into $6.3 billion theft
Binance’s investigation links the theft to a modified Homebrew download, a fake interview and abuse of an internal AI tool.
Reddit user explains why Claude Code weekly limits are burning almost 4x faster
A Reddit user compared token usage across two weeks and found that each 1% of Claude Code's weekly limit now yields far fewer output tokens, pointing to subagents, reasoning time, and UI refresh requests as likely causes.